Whether you’re a shellcode author or a malware analyst, you will inevitably end up debugging shellcode at some point. For simple shellcode this can be straightforward enough, but in complex cases Time Travel Debugging (TTD) can be game changer, allowing you to play, replay, and rewind an execution trace that was taken locally or from an analysis VM.
One of the historical down sides to TTD is it’s hard to make use of any static analysis you’ve performed, however Binary Ninja’s TTD capability allows us to debug a TTD trace while also making use of our analysis like function names, variables, etc.
Seeinglogic has an excellent blog post on TTD with Binary Ninja for executables, but one of the use cases we often face that is analysis of position independent code, or shellcode, outside of the PE format. Using a TTD with Binary Ninja in this way has a few additional hurdles, as you can’t just run the shellcode like you can an executable.
In this blog post we will walk through how to TTD shellcode in Binary Ninja, so we can get the best of both worlds!
Analyse Your Shellcode
For this tutorial we’re going to use a basic x86 Metasploit reverse shell shellcode for Windows. You can follow along by grabbing the shellcode here:
The first step is of course to perform whatever analysis we can in Binary Ninja. This post will be using version 4.3.6507-dev. We’ll start by opening the shellcode, and as it is not a recognisable file format we are presented with the ‘Open with Options’ dialog. We know the shellcode is executed from the start, so the entry offset is just set to 0, and we know the platform is Windows x86 so we’ll set that.
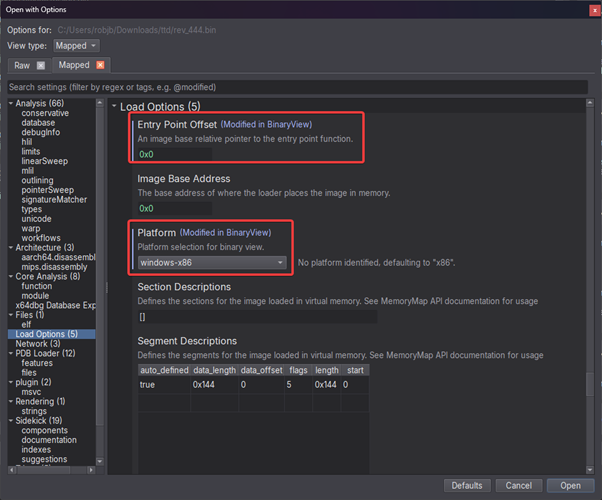
Loading the shellcode into binary ninja.
After analysis completes, we are then presented with the start of the shellcode. Binary Ninja has already helpfully set some types, such as the PEB.
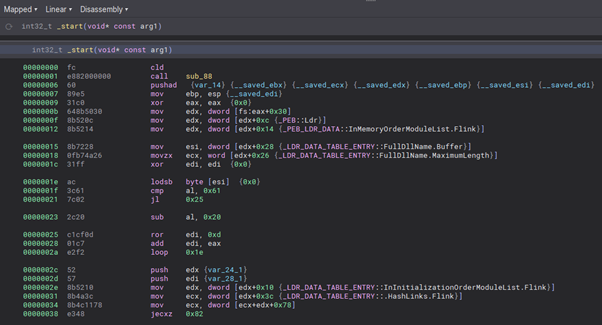
The start of the shellcode.
We can perform any analysis we would like, then when we are ready we can capture our TTD trace.
Capturing the Trace
We can’t just run shellcode like we can an executable as the Operating System doesn’t know what to do with it. Instead, we’re going to use a shellcode runner to bootstrap the process then load and run the shellcode.
We’re going to use OALab’s Blobrunner to do this, but there are many good options.
We’ll load up our analysis Virtual Machine as we’re going to be executing the shellcode and then run it with Blobrunner (note there is a bug in BlobRunner64 where the pointer value gets truncated, so use this fix or a different shellcode runner if using 64bit shellcode). The aim isn’t just to execute it however, we’ll also need TTD.exe to record the trace.
All we need is TTD.exe itself, so we can copy that into our testing VM along with our shellcode and BlobRunner and then record the trace.
.\TTD.exe .\blobrunner.exe .\rev_444.bin
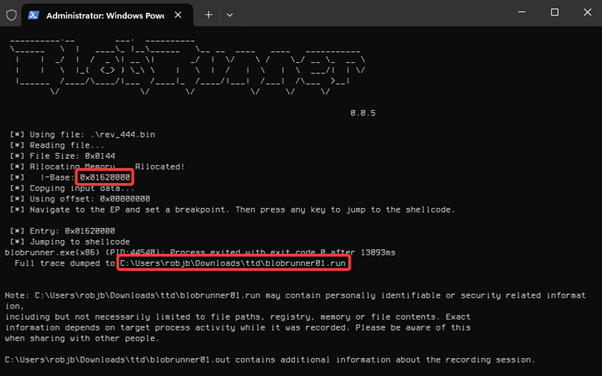
Tracing BlobRunner using TTD.exe
BlobRunner will allocate some memory and load the shellcode at that address - we should note this address for our analysis later. It will then execute the shellcode and dump the trace. Having executed our shellcode in the VM, we can then copy the .run trace file out to our analysis host.
Setting up the Trace
Now we have a trace and we have our analysis database.
We now need to configure the Debug Adapter in Binary Ninja. To do this we go to Debugger -> Debug Adapter Settings and set:
- The Adapter Type to DBGEND_TTD
- The Input File to the path to BlobRunner
- The Executable Path to the path to the trace file
- The Command Line Arguments to the path to our shellcode.
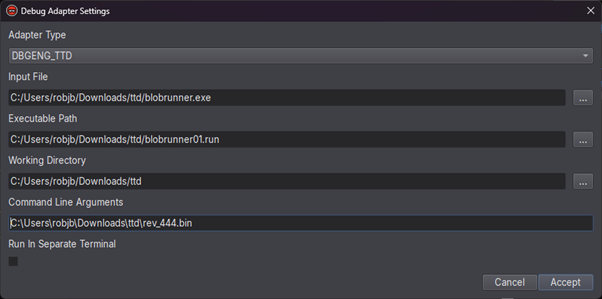
Setting up the debug adapter.
Before we launch, it is worth renaming the _start function to something like shellcode_start, as once we launch the trace the entry to the blobrunner will actually be named _start when Binary Ninja moves this name to the module entrypoint. Renaming the shellcode start to a user defined name will allow us to easily find it later on.
We can then save the database and launch the trace with Debugger -> Launch.
Debugging the Trace
After hitting Launch it may take a few seconds for the debugger to start, depending on the size of your trace.
The first step is to rebase our shellcode in Binary Ninja to match the offset that it was run using BlobRunner. In this case, 0x01620000. We can do this by opening the command palette with Ctrl-P and then typing "rebase" and entering this value.

Rebasing the shellcode.
We should now see the start of our shellcode at this address, which means that it will match the trace.

The rebased shellcode.
Once the trace has started, it will have to run to the end of the trace, so the best option is to run the trace to the start by hitting "Go Backwards".

Return the trace to the start.
Now we can either step forwards, or a better option would be to set a breakpoint on our shellcode start and hit play.
We’ll set a breakpoint on the start of our shellcode with bp 0x01620000 and then enter g to start running, and we then hit our shellcode!
Now we can debug a trace of the shellcode on even using the decompilation in Binary Ninja and getting to work on our analysis dynamically as well as statically.
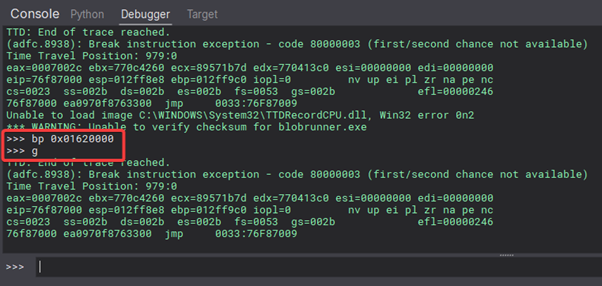
Setting the breakpoint on our shellcode and then running the trace.
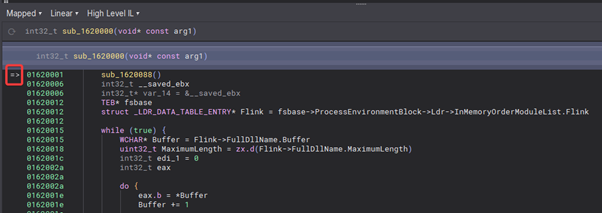
Hitting our shellcode.
We now get all the benefits of a TTD trace, stepping forwards and backwards etc without having to actually execute the sample on our analysis host. We get Binary Ninja’s decompilation and are able to see and improve analysis we have performed. Any renaming, types, etc, we have performed are visible in our debugging session and any renaming we do during our debugging session will be saved to the analysis after we stop debugging.
This technique can be incredibly useful both for malware analysts and malware authors. Being able to Time-Travel Debug the compiled shellcode during development using Binary Ninja’s decompiler and symbols makes the process much easier, particulary when being able to apply signatures to your unchanged functions using Binary Ninja’s signature kit, or their new WARP feature.
Thanks to @Xusheng from the Vector35 team for helping me to get this working and his awesome work on the debugger.


